Utilities Gave It All Back
A five-day round trip in the market's favorite defensive trade, and what quietly took its place.

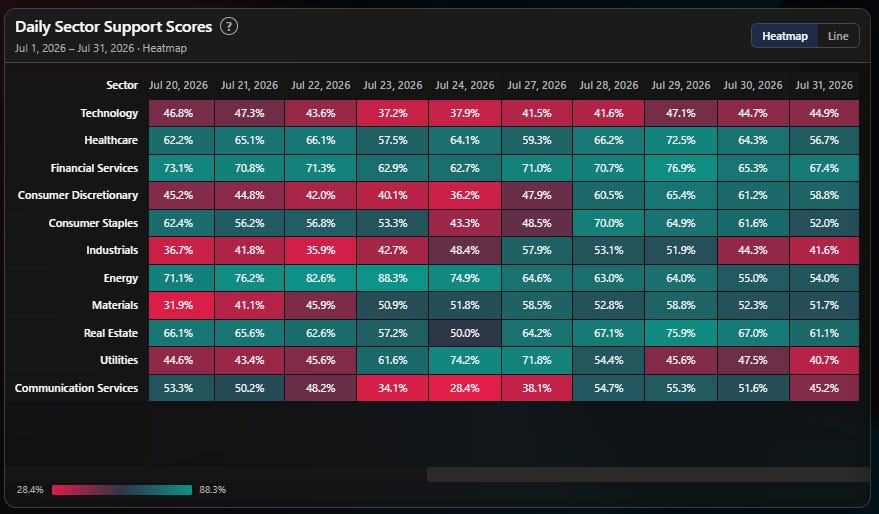
Two Fridays ago, Utilities closed the week at a support score of 74.2. That means roughly three-quarters of the sector’s historical high-volume price levels were sitting below the current price, a genuinely strong reading, and it was the single biggest mover in my board that week, up about 30 points off Monday’s 44.6. It read like a defensive bid building into a nervous macro backdrop. I flagged it as a read, not a conclusion, because one week of level data proving a trend is a good way to get embarrassed the following week.
This week, Utilities gave it all back. It opened Monday at 71.8, still riding the prior week’s momentum, and closed Friday at 40.7. That is a 31.1-point drop in four sessions, almost the mirror image of the run that got it. The defensive bid did not survive the week that would have confirmed it.
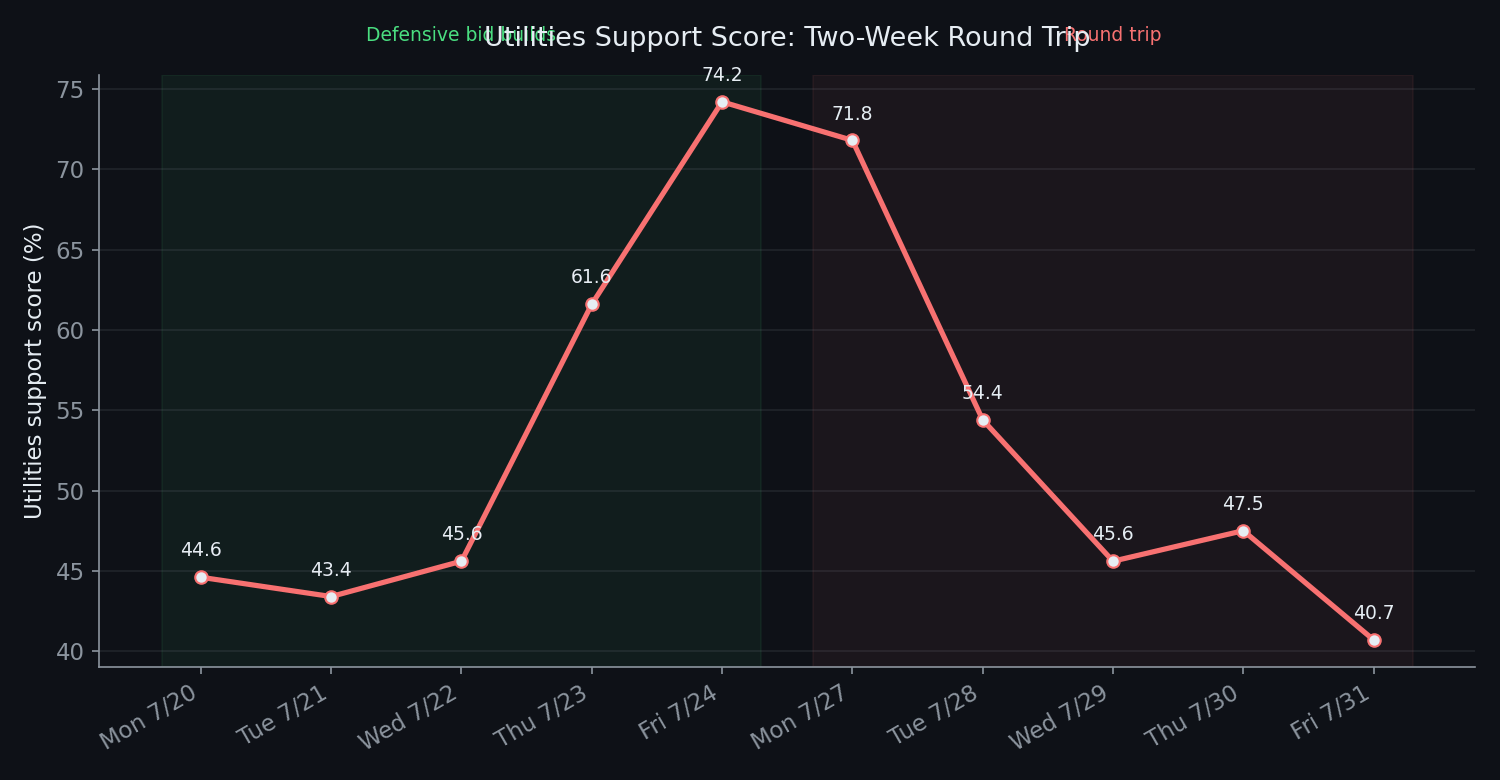
Utilities was the extreme case, but it was not alone. This was a week where the “hard asset” leadership that took the wheel in the back half of July, Energy, Materials, Industrials, Utilities, gave a lot of it back, while the sectors that had been struggling for a month, Consumer Discretionary, Communication Services, Technology, quietly found their footing.
The shape of the week
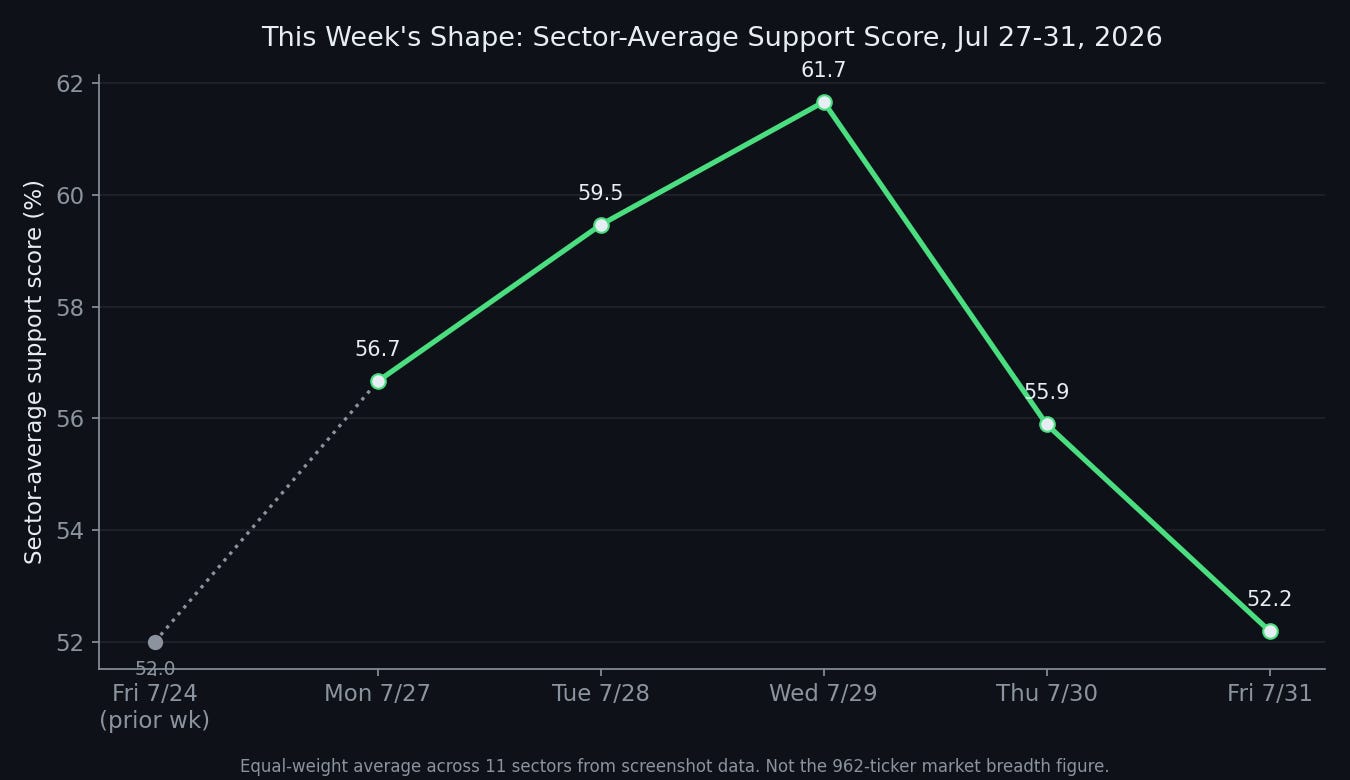
Averaged equal-weight across the eleven GICS-style sectors I track and share here, support opened Monday at 56.7, climbed through Tuesday and Wednesday to a midweek high of 61.7, then rolled over hard, closing Friday at 52.2.
That closing number is almost identical to where the prior week ended, 52.0. The market spent five sessions rallying and retreating and finished exactly where the last one left off. If you only checked in on Wednesday, you would have written a very different week’s story than the one the data actually tells.
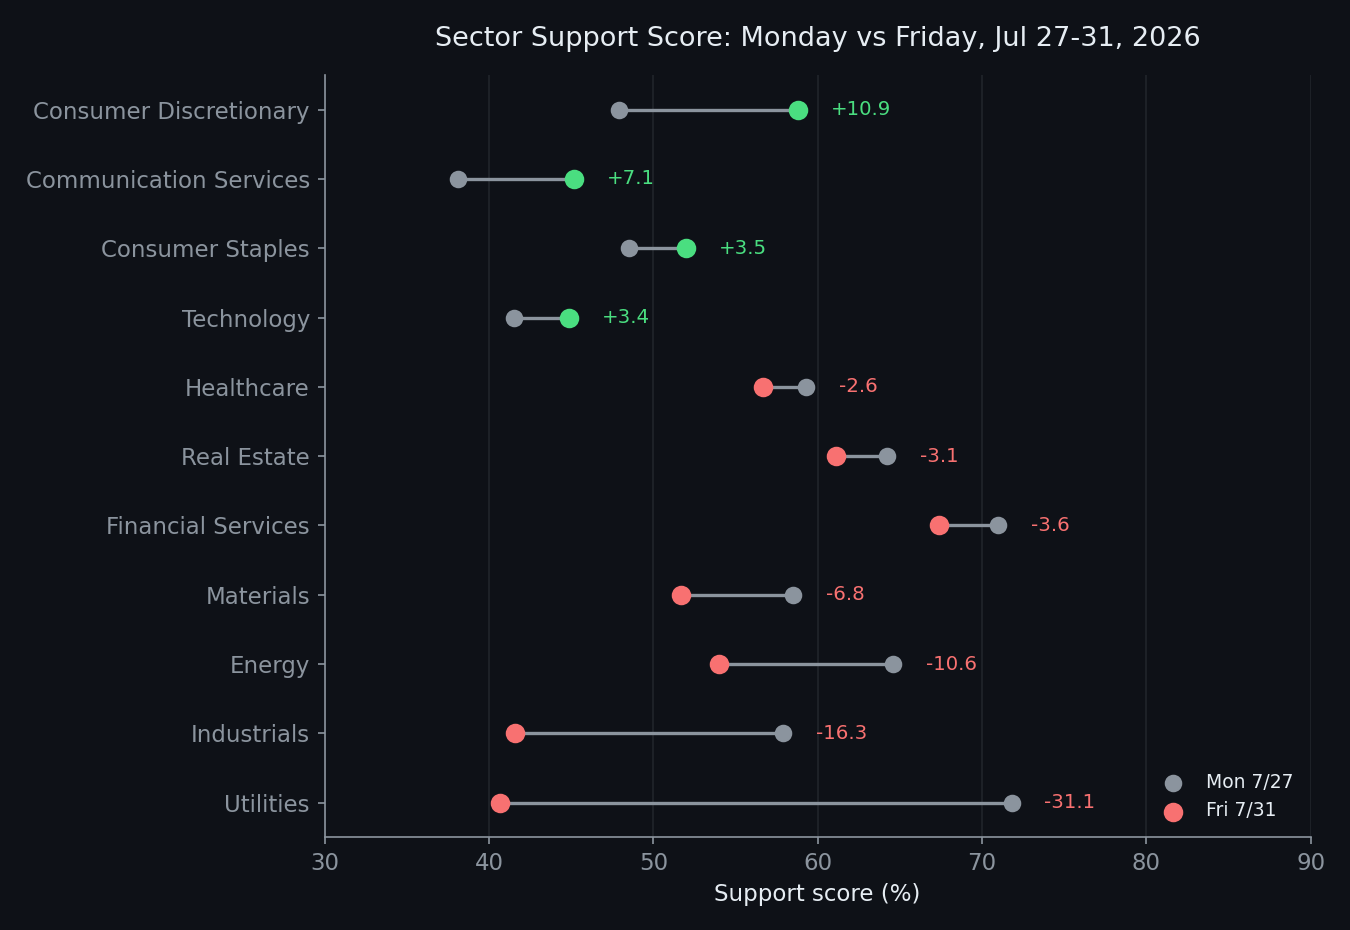
Sector by sector, the week’s net change (Monday close to Friday close) breaks cleanly into two camps.
Losers: Utilities (-31.1), Industrials (-16.3), Energy (-10.6), Materials (-6.8), Financial Services (-3.6), Real Estate (-3.1), Healthcare (-2.6).
Winners: Consumer Discretionary (+10.9), Communication Services (+7.1), Consumer Staples (+3.5), Technology (+3.4).
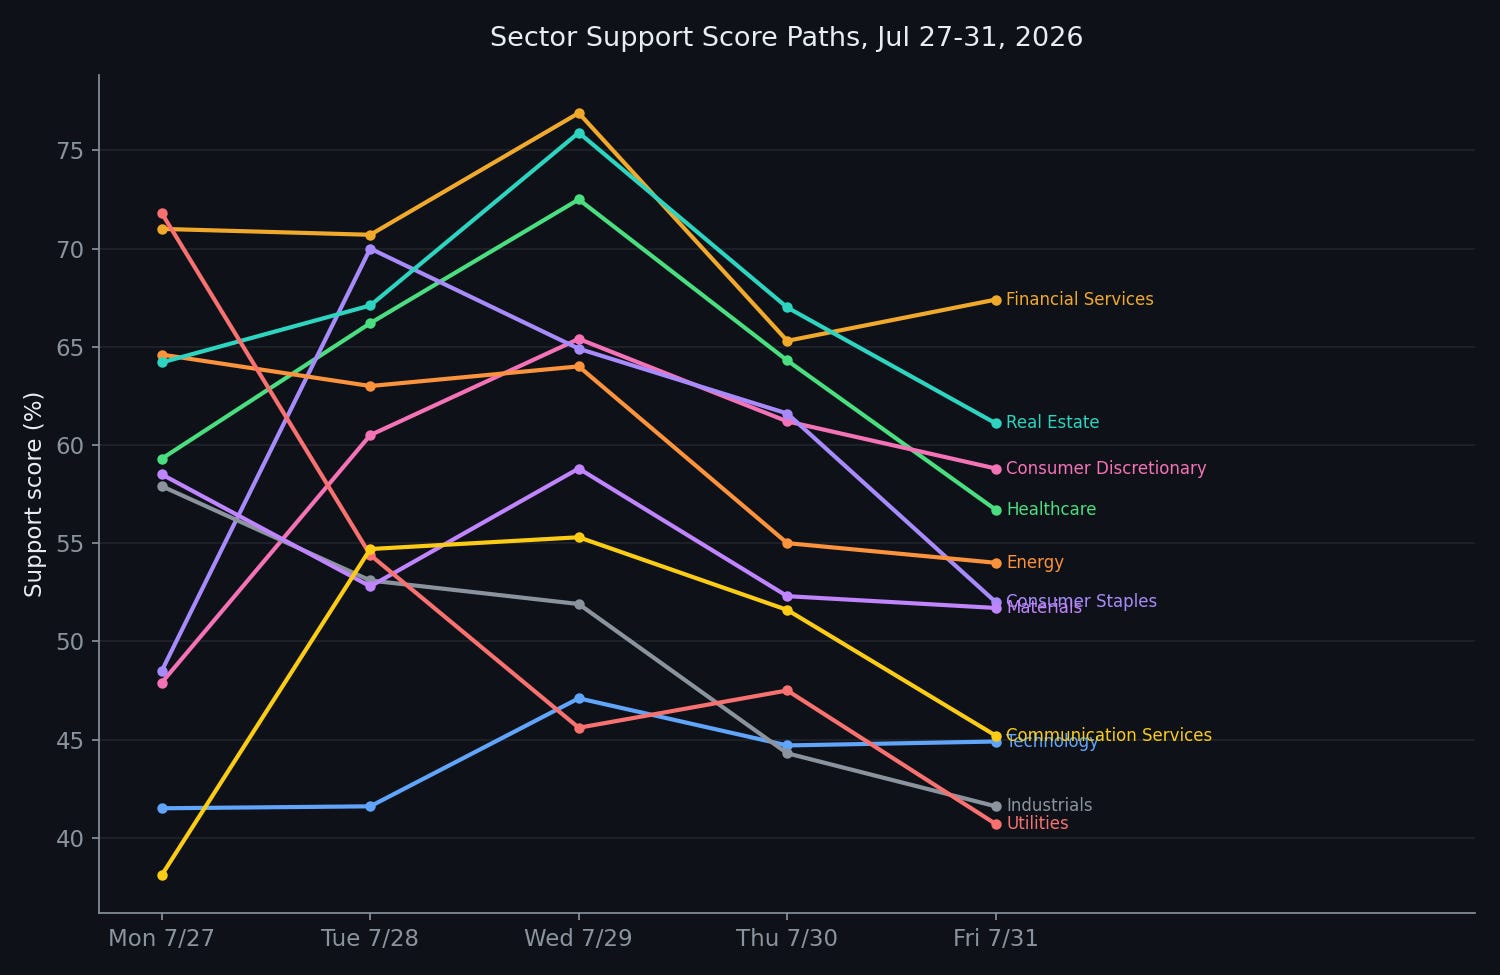
Energy deserves its own line. It peaked at 88.3 on July 23, the strongest single-sector reading of the entire month, and has now given back 34.3 points from that peak in six trading sessions, closing this week at 54.0. That is the sector that, two weeks ago, was the entire thesis. Oil grabbed the wheel. This week, its grip loosened noticeably, at least by this measure.
Three instruments, one story
My data alone would be a decent case for a rotation reversal. What makes me more confident is that two independent reads agree with it.
First, the Relative Rotation Graph. Consumer Discretionary, Consumer Staples, Technology, Industrials, Materials, and Communication Services are all sitting in the Improving quadrant, below the 100 line on relative strength but climbing on relative momentum, which is the RRG’s way of saying these names are still behind but gaining ground. That is the same group, roughly, that improved in my support-score data this week. Two instruments built from completely different inputs, one from where institutions have actually transacted, one from price momentum relative to the market, are pointing at the same handful of sectors.
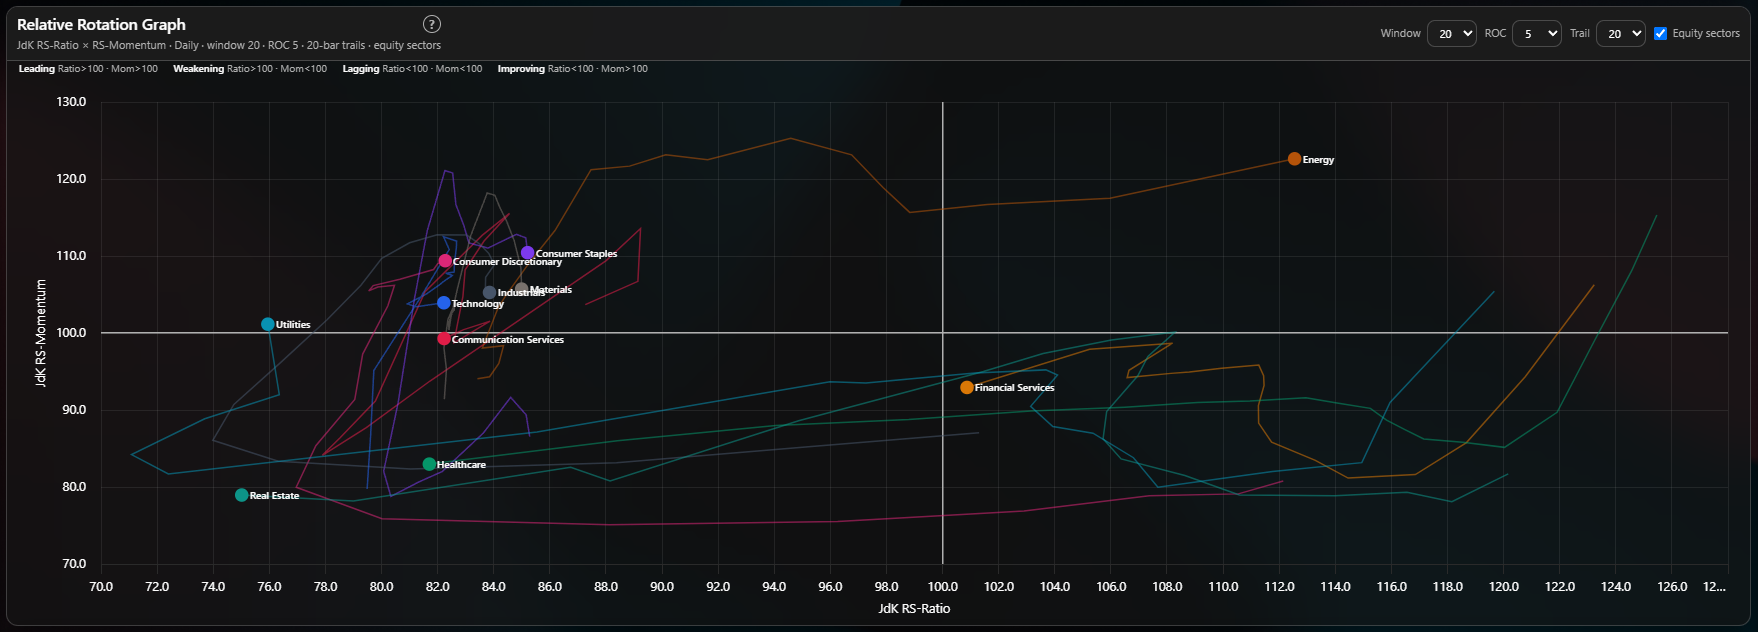
Financial Services is the RRG’s other tell. It sits right at the 100 boundary on relative strength but has slipped below 100 on momentum, the textbook signature of a leader that is running out of steam before its price shows it. My data agrees: Financial Services was down 3.6 points on the week, its fourth straight week of fading support after leading much of the summer.
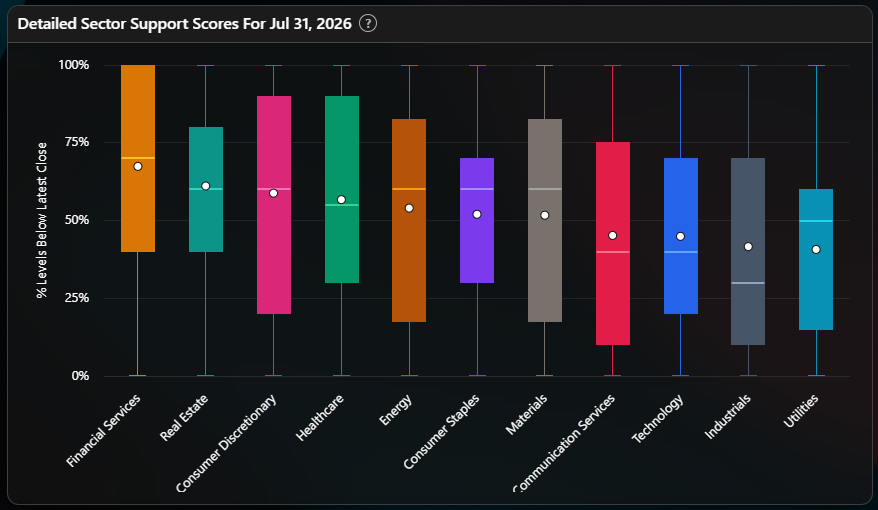
Second, the detailed support-score breakdown for Friday. This is the box plot, not the headline number, and it tells you something the headline can hide. Technology and Industrials both show a mean sitting well above the median, roughly 15 points above in each case. That pattern means the sector average is being propped up by a handful of strong names while the typical name in the sector is much weaker. Think of it like a class average grade held up by two or three straight-A students while most of the room is closer to a C. The average looks fine. The room does not. For Technology and Industrials both, the honest read is to pick names selectively, not buy the sector.
Energy and Materials show the opposite pattern, mean sitting below the median, which means a few weak names are dragging the average down and the typical name is actually holding up better than the headline score suggests. That is worth knowing if you are inclined to write Energy off entirely based on this week’s drop, it is fading, but not uniformly.
Where the data disagrees with itself, and the tell that would settle it
My support-score data says Energy’s participation is thinning fast, down more than 34 points from its July 23 peak. The RRG says Energy is still the cleanest leader on the board, furthest out and up of any sector, with a trail that has been climbing steadily since early July and has not yet turned down.
Both can be true at once. Level-based support data tends to move with positioning, where price sits relative to where big prior volume happened, which can shift before the price trend itself breaks. The RRG is built on relative price strength and momentum, which is stickier and slower to turn, especially for a sector riding a real macro catalyst. Exxon and Chevron both report earnings today, which will matter more to Energy’s price trend over the next few sessions than anything in my board.
The tell that would resolve this: watch whether Energy’s RRG trail actually crosses down through the momentum-100 line into the Weakening quadrant over the next two to three weeks. If it does, that is price finally catching down to what the level data has been signaling since July 23. If Energy’s price keeps making new highs while its support score keeps fading, that would say the earnings-day movers are carrying the tape while the broader base of energy names quietly loses ground underneath, the same propped-up-average pattern we are already seeing in Technology and Industrials.
A note on the volume
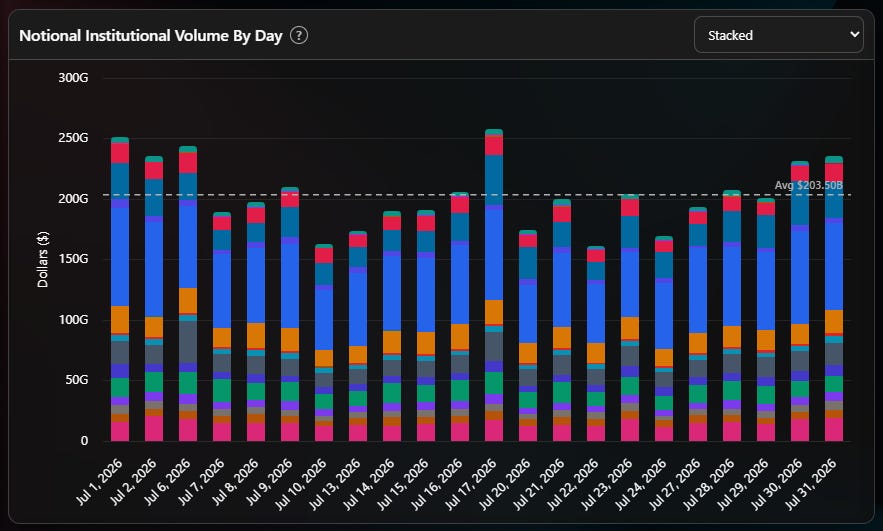
Institutional notional volume ran noticeably above the month’s roughly $203.5 billion daily average on both Thursday and Friday, the two heaviest days of the week and among the heaviest of the month while price was moving up in indices. Thursday, July 30 was also the session with an outsized 5.05 percent Technology return, which lines up with what the macro press is chirping about everywhere you look: a tech-led market rebound following Wednesday’s selloff. Friday, July 31 is calendar month-end and we’re now in a period where end-of-month and beginning-of-month flows will leads to some position shuffling.
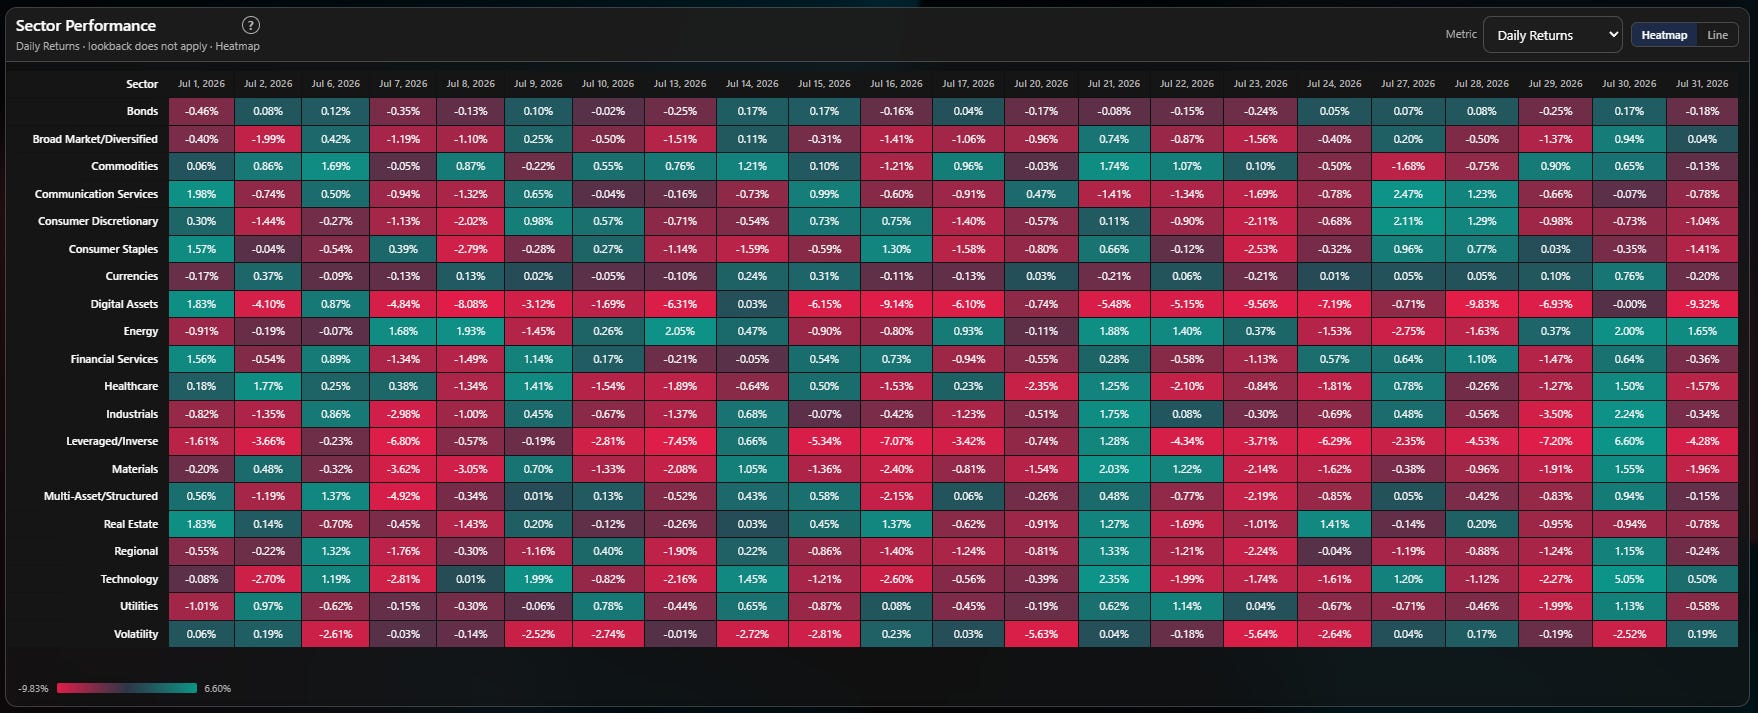
Size is not direction, a big print shows where business happened, not who won it, and month-end is exactly the kind of date that generates mechanical rebalancing flow rather than fresh conviction. I would not lean hard on Thursday and Friday’s volume as a standalone signal of anything. It is context for why the week’s reversal happened on heavy tape, not proof of what the reversal means.
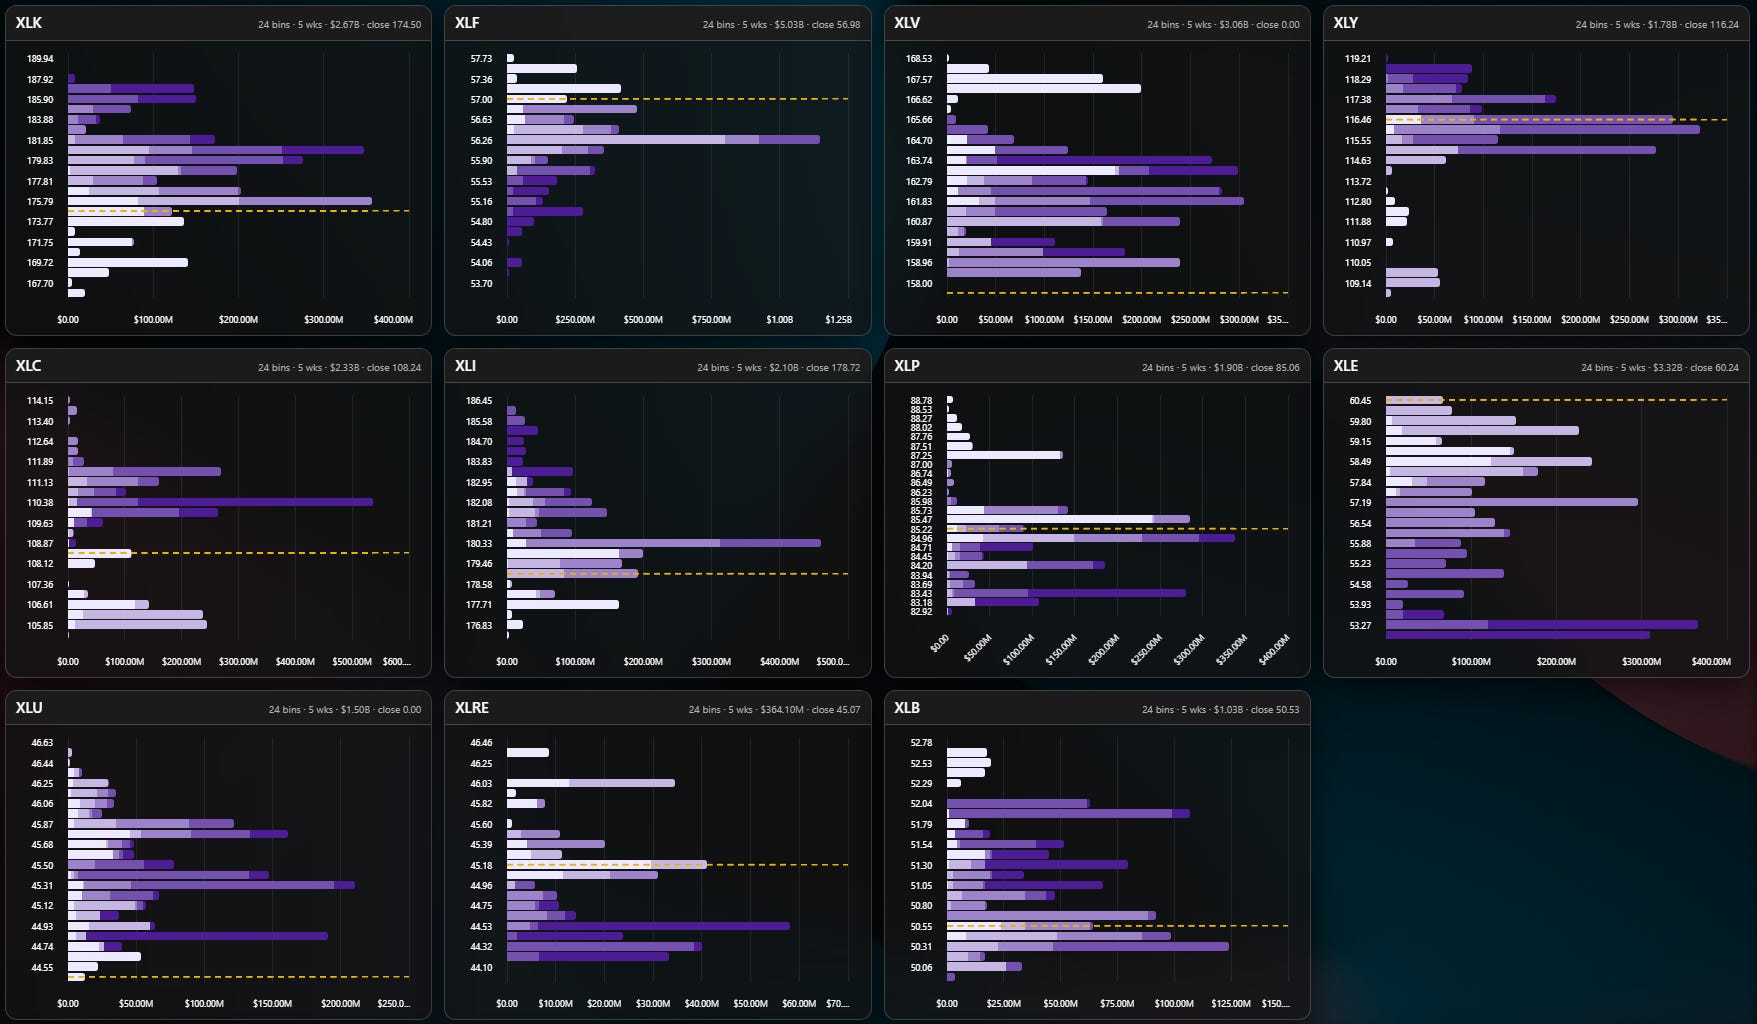
Here are some highlights from today’s institutional tape to pontificate on over the weekend as well as institutional positioning in the majors+sector ETFs; for the full recap, login and head to the Sector Breakdown Dashboard:
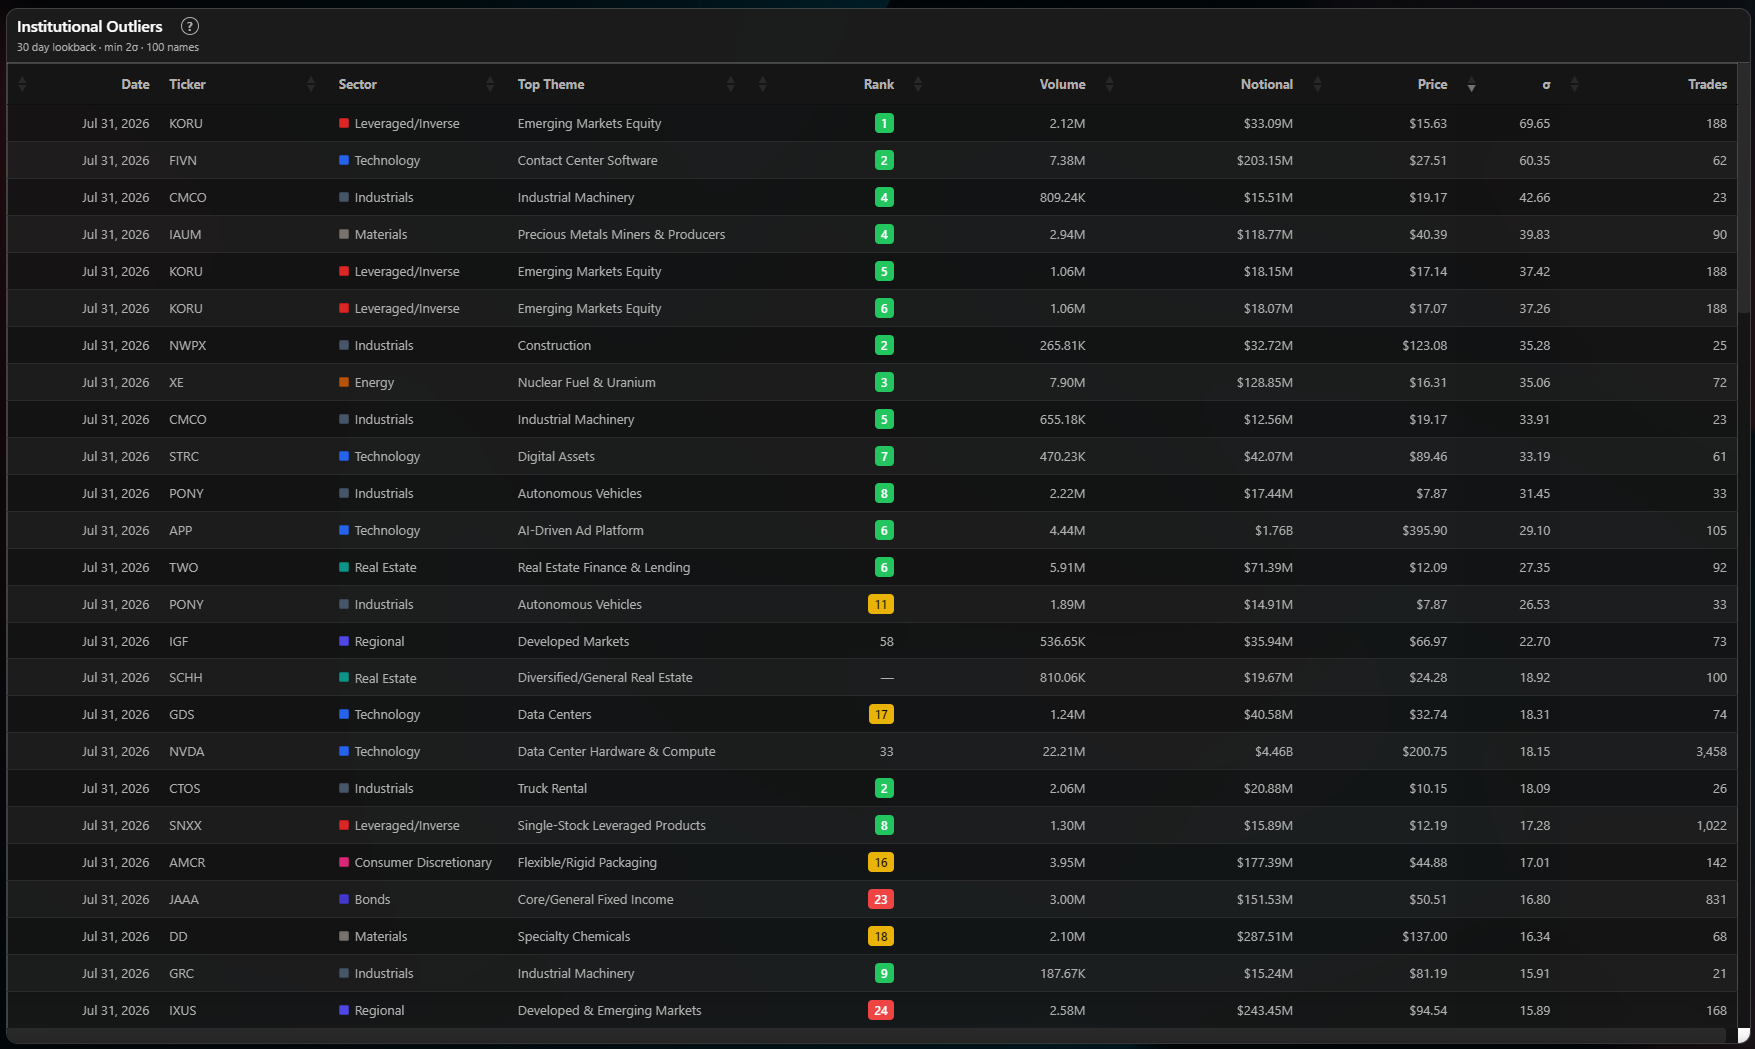
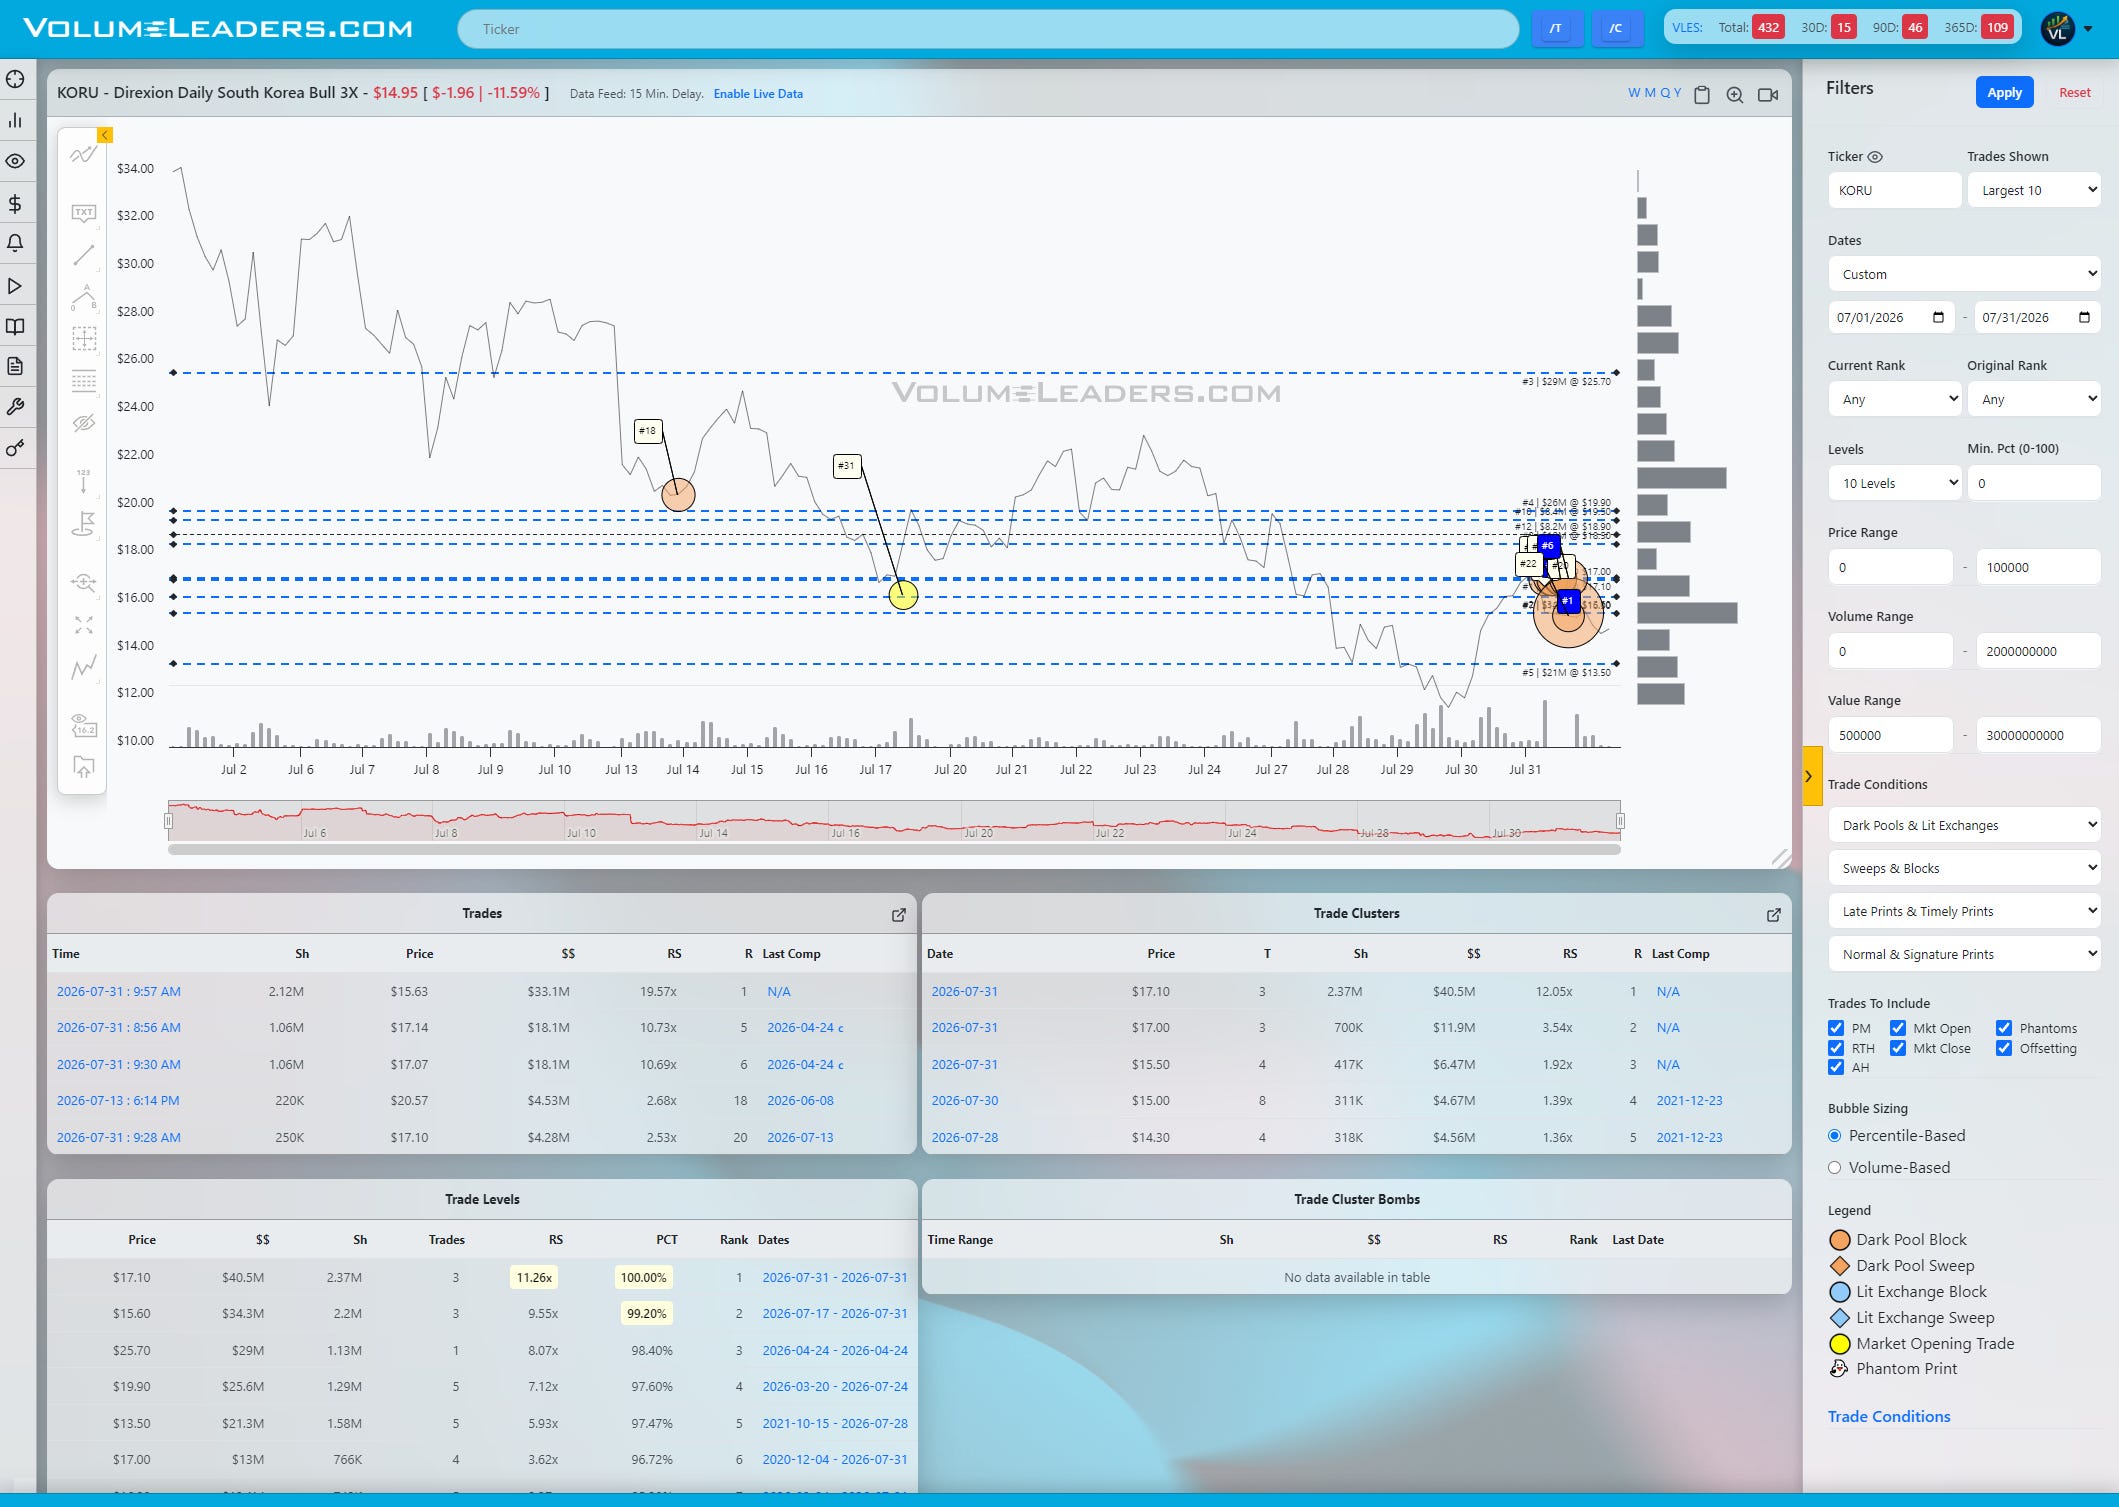
(If you’re a member, you have to login and check out this absolute blitz in prints at the lows in KORU, a 3X Leveraged Bull South Korea ETF)

The macro backdrop
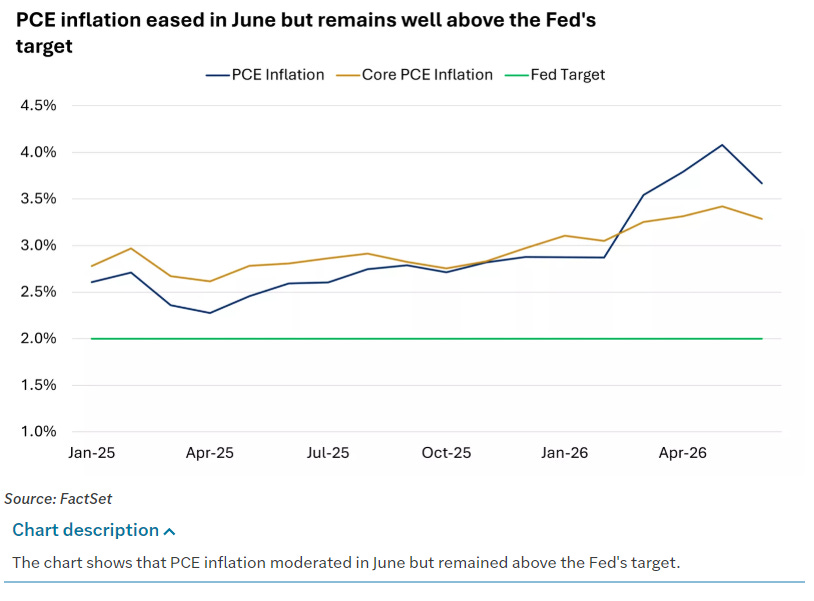
None of this happened in a vacuum. The Fed met Wednesday and held rates steady, which is about what most were thinking. The 9-3 vote, three dissents on a twelve-member committee is an unusually loud split for a hold, and it lines up with the hawkish undertones we’ve heard before: energy-driven inflation risk that has not gone away, even as June inflation as cooling and GDP growth as decelerating. The Fed is not fully settled on this, and neither, it turns out, is the data.
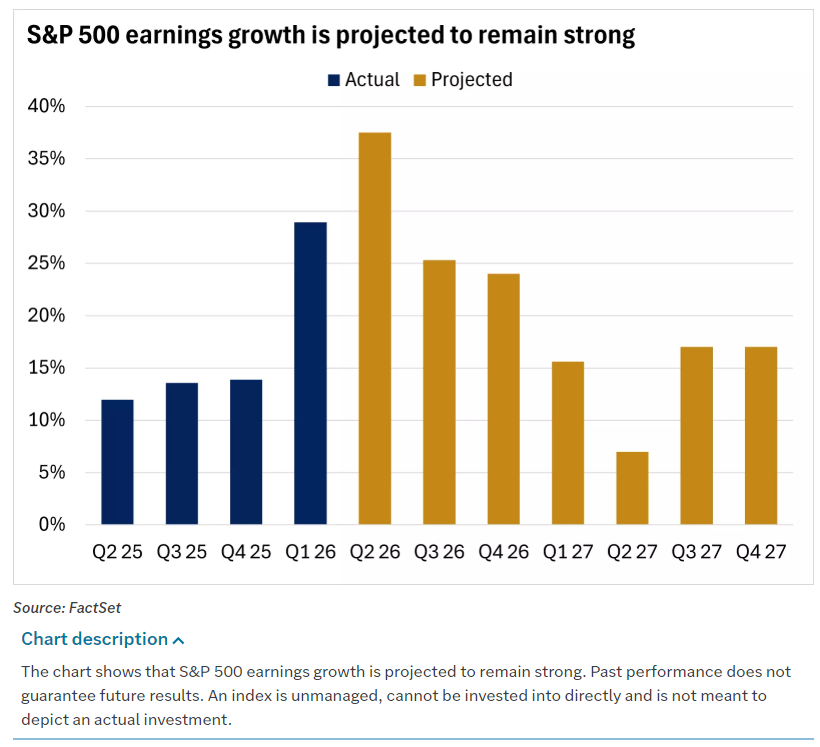
The bigger driver of this week’s price action looks to have been earnings, not the Fed. The financial news cycles shifted gears this week’s with mega-cap technology earnings, not oil, a real deviation in headlines from the prior two weeks, with a tech-led Thursday rebound that cracked the market back above the declining trendline that had capped it since July 17.
Put together, that gives this week’s rotation a plausible macro explanation, one my proprietary data cannot supply on its own. The hard-asset trade that took over in mid-July was built on energy-driven inflation risk. This week, strong mega-cap tech earnings gave growth investors a fresh, sector-specific reason to buy back in, even as the inflation risk behind the energy trade has eased rather than resolved, and the Fed’s own split vote says the committee is still arguing about which way it breaks.
What this means, by your clock
If you trade in days to weeks: the Utilities round trip is the clearest lesson of the week. A single-week move in the support score, even a large one, can be pure positioning that unwinds completely the following week, especially book-ended by month-end flow. Treat one-week extremes in this data as a read, not a signal, until they survive a second week. On Energy specifically, the level data and the price data disagree right now, and price usually wins in the short run, so I would not fight the RRG’s leading read until it actually rolls over.
If you invest in months to years: the more interesting question is whether the hard-asset leadership that took over from Financials and Healthcare in mid-July is genuinely handing off back to growth and cyclical consumer names, or whether this is just a mid-summer wobble inside a longer commodity-driven trend. This week’s data leans toward handoff, Discretionary, Communication Services, and Technology all improved while Energy, Materials, Industrials, and Utilities all faded, but one week is one week. The next two to three weeks, and specifically whether Energy’s RRG trail actually turns down, will tell you which story you are in.
Talk soon, Bruce